📊 Using pandas_datareader to Access Real Financial and Economic Data in Python
By Casey Jenkins · October 2025
If you’ve ever wanted to pull real-world economic or market data straight into your Python environment — no messy CSV downloads, no browser scraping — the pandas_datareader library is your friend. It connects your code directly to public data sources like the Federal Reserve (FRED), Yahoo Finance, and others, returning clean Pandas DataFrames ready for analysis.
pandas_datareader is a lightweight add-on to Pandas that lets you fetch live or historical data from various APIs. It integrates seamlessly with pandas, so the data comes in already indexed by date, ready for plotting or analysis.pip install pandas-datareader
Once installed, import it like this:from pandas_datareader.data import DataReader
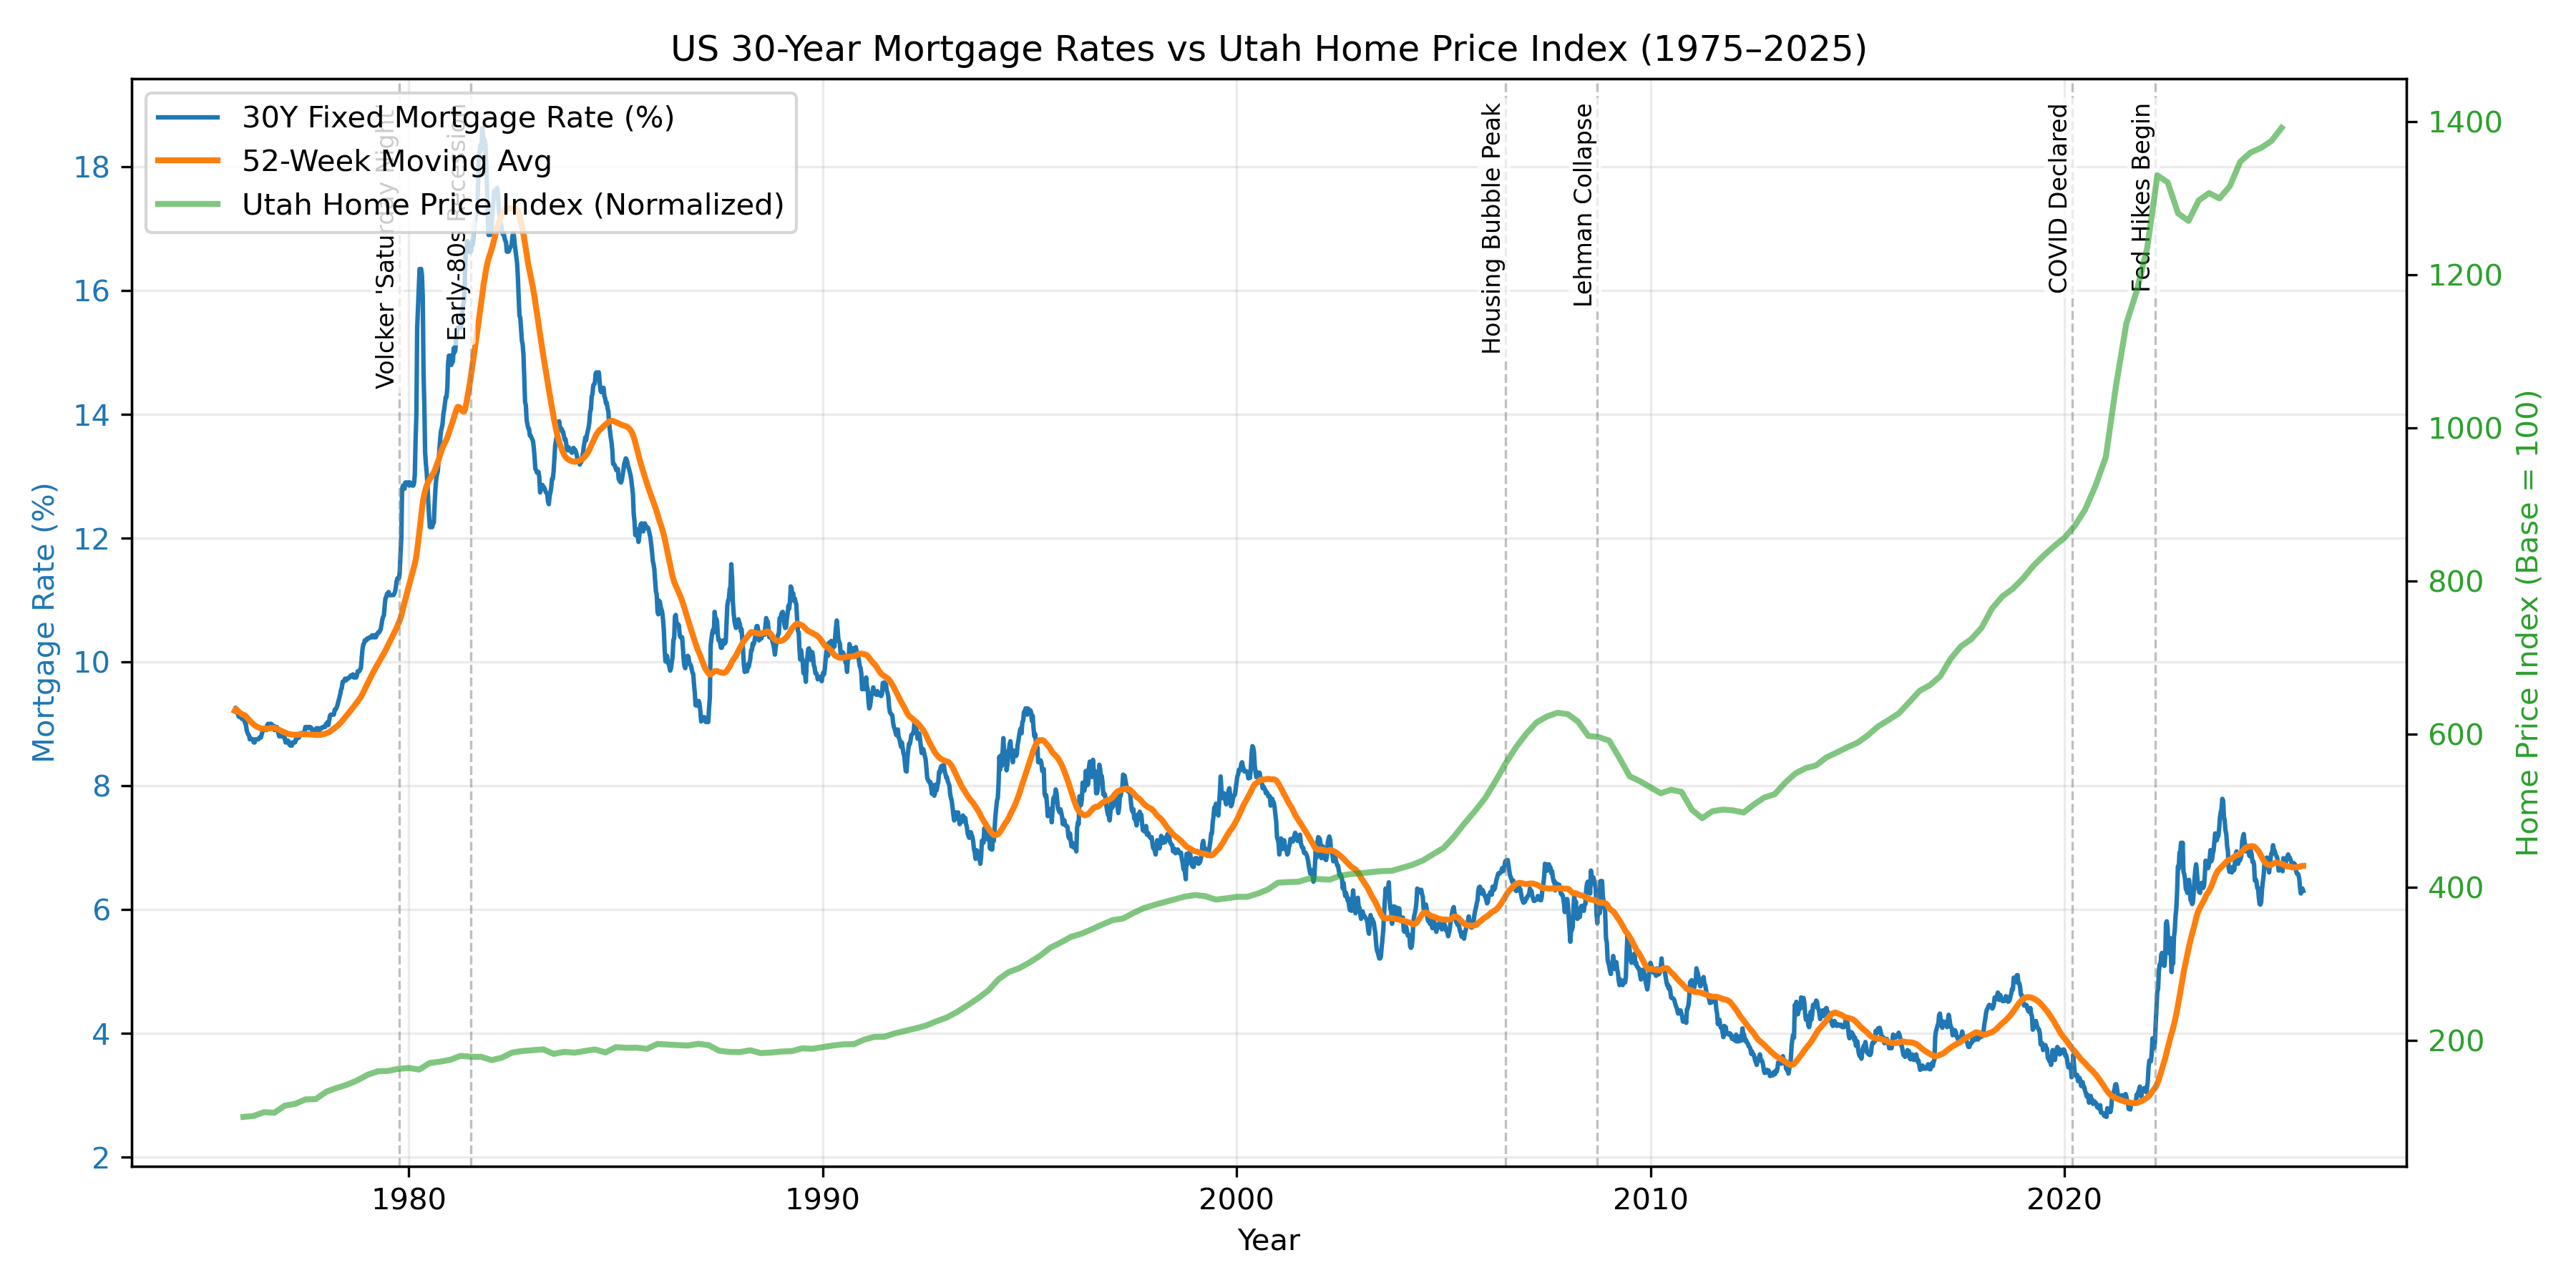
Here’s how to grab 50 years of U.S. 30-year fixed mortgage rates (ticker MORTGAGE30US) from the Federal Reserve Economic Data (FRED):import pandas as pd
from pandas_datareader.data import DataReader
# 50 years back
end = pd.Timestamp.today()
start = end - pd.DateOffset(years=50)
# Fetch from FRED
rates = DataReader("MORTGAGE30US", "fred", start, end)
print(rates.tail())
Output: MORTGAGE30US
DATE
2025-09-19 6.55
2025-09-26 6.61
2025-10-03 6.63
That’s a clean weekly time series — instantly ready for visualization or modeling.
Let’s visualize the trend with a one-year moving average:import matplotlib.pyplot as plt
rates["MA52"] = rates["MORTGAGE30US"].rolling(52).mean()
plt.figure(figsize=(10,5))
plt.plot(rates.index, rates["MORTGAGE30US"], label="30Y Fixed Rate")
plt.plot(rates.index, rates["MA52"], label="52-Week Moving Avg", linewidth=2)
plt.title("U.S. 30-Year Fixed Mortgage Rates (1975–2025)")
plt.xlabel("Year")
plt.ylabel("Percent")
plt.grid(True, alpha=0.3)
plt.legend()
plt.show()
This produces a smooth historical chart showing rate cycles, recessions, and the modern rise in borrowing costs.
🔎 Other Popular FRED Tickers
| Series Code | Description | |————–|————–| | CPIAUCSL | Consumer Price Index (Inflation) | | GDP | U.S. Gross Domestic Product | | UNRATE | Unemployment Rate | | MORTGAGE30US | 30-Year Fixed Mortgage Rate | | UTSTHPI | Utah Home Price Index |
You can fetch multiple series and merge them by date for richer analysis.
Besides FRED, pandas_datareader supports Yahoo Finance, World Bank, OECD, and Nasdaq Data Link (Quandl). You can even build your own data connectors for private APIs.
pandas_datareader eliminates the need for manual CSV downloads, keeps data up-to-date, and integrates seamlessly with Python’s powerful analysis ecosystem — making it ideal for economic research, time-series modeling, and data visualization.
pandas_datareader turns Python into a live data terminal — one that can query the Federal Reserve, Yahoo Finance, or World Bank in seconds. Whether you’re studying mortgage rates, inflation, or stock returns, it’s the cleanest way to bridge code and the economy.
Next step: try combining FRED data with your own models — for example, correlating mortgage rates, home prices, and inflation trends in one chart.
Thanks for Screwing Us ~Jen Jill