When in college I took a discrete math class, we went around the room and shouted out our birthday, we got to the 17th person and we had a match.
The birthday paradox, also known as the birthday problem, states that in a random group of 23 people, there is about a 50 percent chance that two people have the same birthday. Is this really true?
Though there are other ways to approach this problem with built-in functions the example below shows some of the individual steps. For two people it’s fairly straight forward and with a group of about 22 people the probability that two people share the same birthday is about 0.5. For groups approaching 50 there is an extremely high probability that two people share the same birthday.
Probability Plot 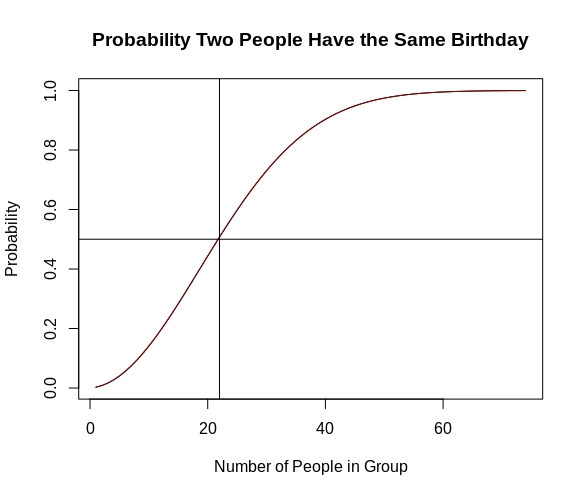
When determining that three (or more) people have the same birthday the probability decreases fairly quickly compared to measuring only two people. A fairly large group would be needed to find three people with the same birthday.
Probability plot for more than two people 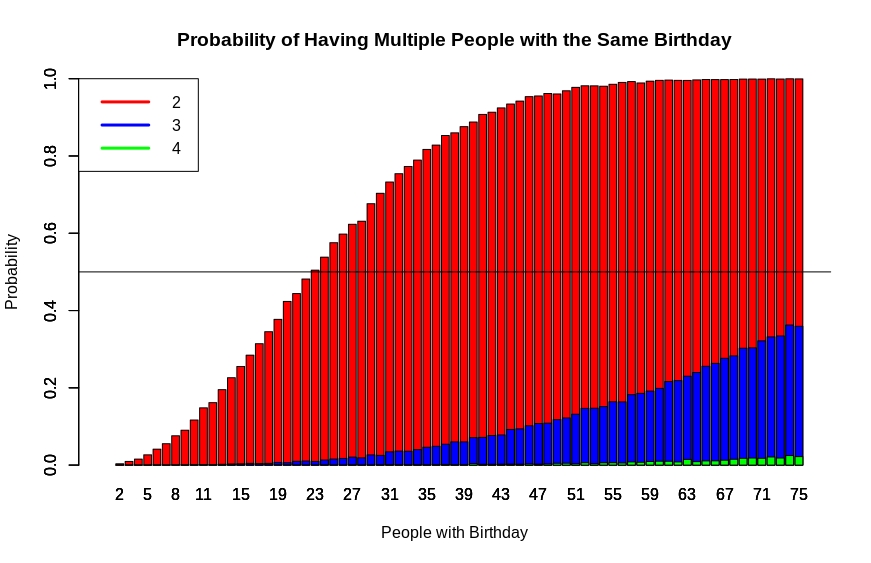
n.rep = 5000
theta.val = 75
doy = seq(from=1, to=365, by=1)
sim.mat = matrix(NA, nrow=theta.val, ncol=4)

getProb = function(n){
q = 1 - seq(0,n-1)/365
p = 1 - prod(q)
}

theta.list = seq(from=2, to=75, by=1)
p.graph = sapply(theta.list, getProb)
fifty.fifty = which(p.graph >.5)[1]
plot(p.graph, main="Probability Two People Have the Same Birthday", ylab='Probability', xlab="Number of People in Group", type = "l")
lines(p.graph, type = "l", col = "darkred")
abline(h=.5, v=fifty.fifty, col = "black")

## For matching multiple people

## Runs a little slow.
for(i in 2:theta.val){
bday = replicate(n.rep, sample(doy, size=i, replace=T) )
bday[1,]
bday.table = apply(bday, 2, table)

sim.2 = ifelse( unlist( lapply(bday.table, max) ) >=2, 1, 0)
sim.3 = ifelse( unlist( lapply(bday.table, max) ) >=3, 1, 0)
sim.4 = ifelse( unlist( lapply(bday.table, max) ) >=4, 1, 0)
sim.mat[i,1] = i
sim.mat[i,2] = sum(sim.2)/length(sim.2)
sim.mat[i,3] = sum(sim.3)/length(sim.3)
sim.mat[i,4] = sum(sim.4)/length(sim.4)
}

graph.sim = t( sim.mat[,2:4] )
colnames(graph.sim) = sim.mat[,1]

barplot(graph.sim[1,], ylim=c(0,1), col="red",
main="Probability of Having Multiple People with the Same Birthday",
xlab="People with Birthday",
ylab="Probability")
barplot(graph.sim[2,], ylim=c(0,1), col="blue", add=T)
barplot(graph.sim[3,], ylim=c(0,1), col="green", add=T)
abline(h=.5)
legend("topleft", c("2","3","4"), col=c("red","blue","green"), lwd=3)